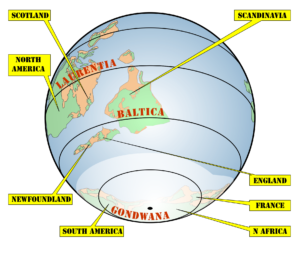
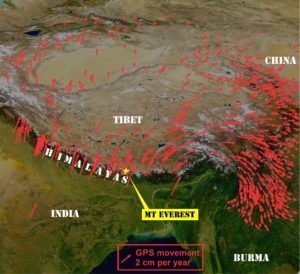
Graphics by Howard Lee:
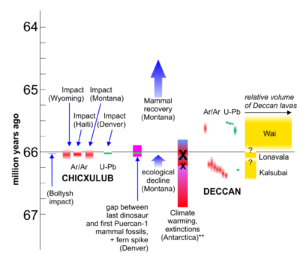
How it all lines up so far: Rock dating of Chicxulub impact (left), recently published information on terrestrial and marine extinctions (middle), and recent dates for Deccan lavas. Vertical ‘smear’ of dates depicts 1 sigma uncertainties including from systematic sources from published dates. **the timing of the climate warming in Antarctic waters and extinction events is probably much less certain since it relies in part on uncertain end-Cretaceous magnetostratigraphy. Ar/Ar = Argon/Argon radiometric dates, U-Pb = Uranium-Lead radiometric dates. Boltysh impact shown at 2-5,000 years before Chicxulub based on Jolley et al (2010). Wyoming and Haiti dates for impact traces from Renne et al (2013). Denver data from Clyde et al (2016). Montana data from Sprain et al (2015) Antarctic data from Petersen et al (2016), Deccan data from Renne et al (2015) and Schoene et al (2015).
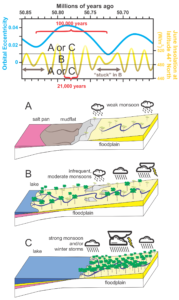
Orbital cycles of climate and landscape in Wyoming during the Eocene. Simplified from Smith et al EPSL 2014. Currently it isn’t clear if either A or C coincide with insolation maxima: salt pans may have coincided with the higher evaporation associated with summer insolation maxima, or alternatively enhancement of the monsoon over the western US due to insolation maxima could have led to high lake levels.
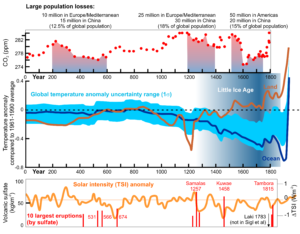
Population decreases and CO2 decreases recorded in ice cores from the Law Dome over the last 2000 years alongside global temperatures, Total Solar Irradiance, and major volcanic eruptions. Population and CO2 redrawn from Ruddiman 2014 "Earth Transformed" figure E-6 (W H Freeman), Temperature anomaly redrawn from Marcott et al 2013 figure S11(c), Volcanic sulfate redrawn from Sigl et al 2013, TSI redrawn from Steinhilber et al 2009 (0=1986 (1365.57 Wm−2)).
